Data Analytics for Web and Social Media
Week 1: Web & Web Analytics
Jan-2026
Table of Contents
Welcome
Course Running Example: ShopSocial
Throughout this course, we’ll analyse ShopSocial, a hypothetical social e-commerce platform where:
- 👥 Users browse and purchase products
- 🔗 Social features: Follow friends and influencers
- 🛍️ Engagement: Share products, write reviews
- 📊 Analytics challenge: How to optimize user experience and sales?
This Week’s Focus: Using web analytics to understand ShopSocial user behaviour
Learning Objectives
By the end of this week, you will be able to:
- Explain the evolution of the web and its impact on analytics
- Identify key web tracking technologies and their privacy implications
- Calculate fundamental web metrics (bounce rate, exit rate, conversion rate)
- Evaluate ethical considerations in web analytics
- Apply clickstream and funnel analysis concepts to real scenarios
Assessment link: These concepts form the foundation for your coursework on analysing digital platform data.
📊 Quick Poll
Wooclap Question
Go to wooclap.com and enter code: LJHCNE
Which “web era” describes how YOU mostly use the internet today?
A. Reading content others created (news, Wikipedia)
B. Creating and sharing content (social media, reviews)
C. Using AI assistants and smart recommendations
D. Interacting with decentralised apps (crypto, NFTs)
Let’s see the results and discuss what this tells us about web evolution…
Evolution of the Web
The Web: Then and Now

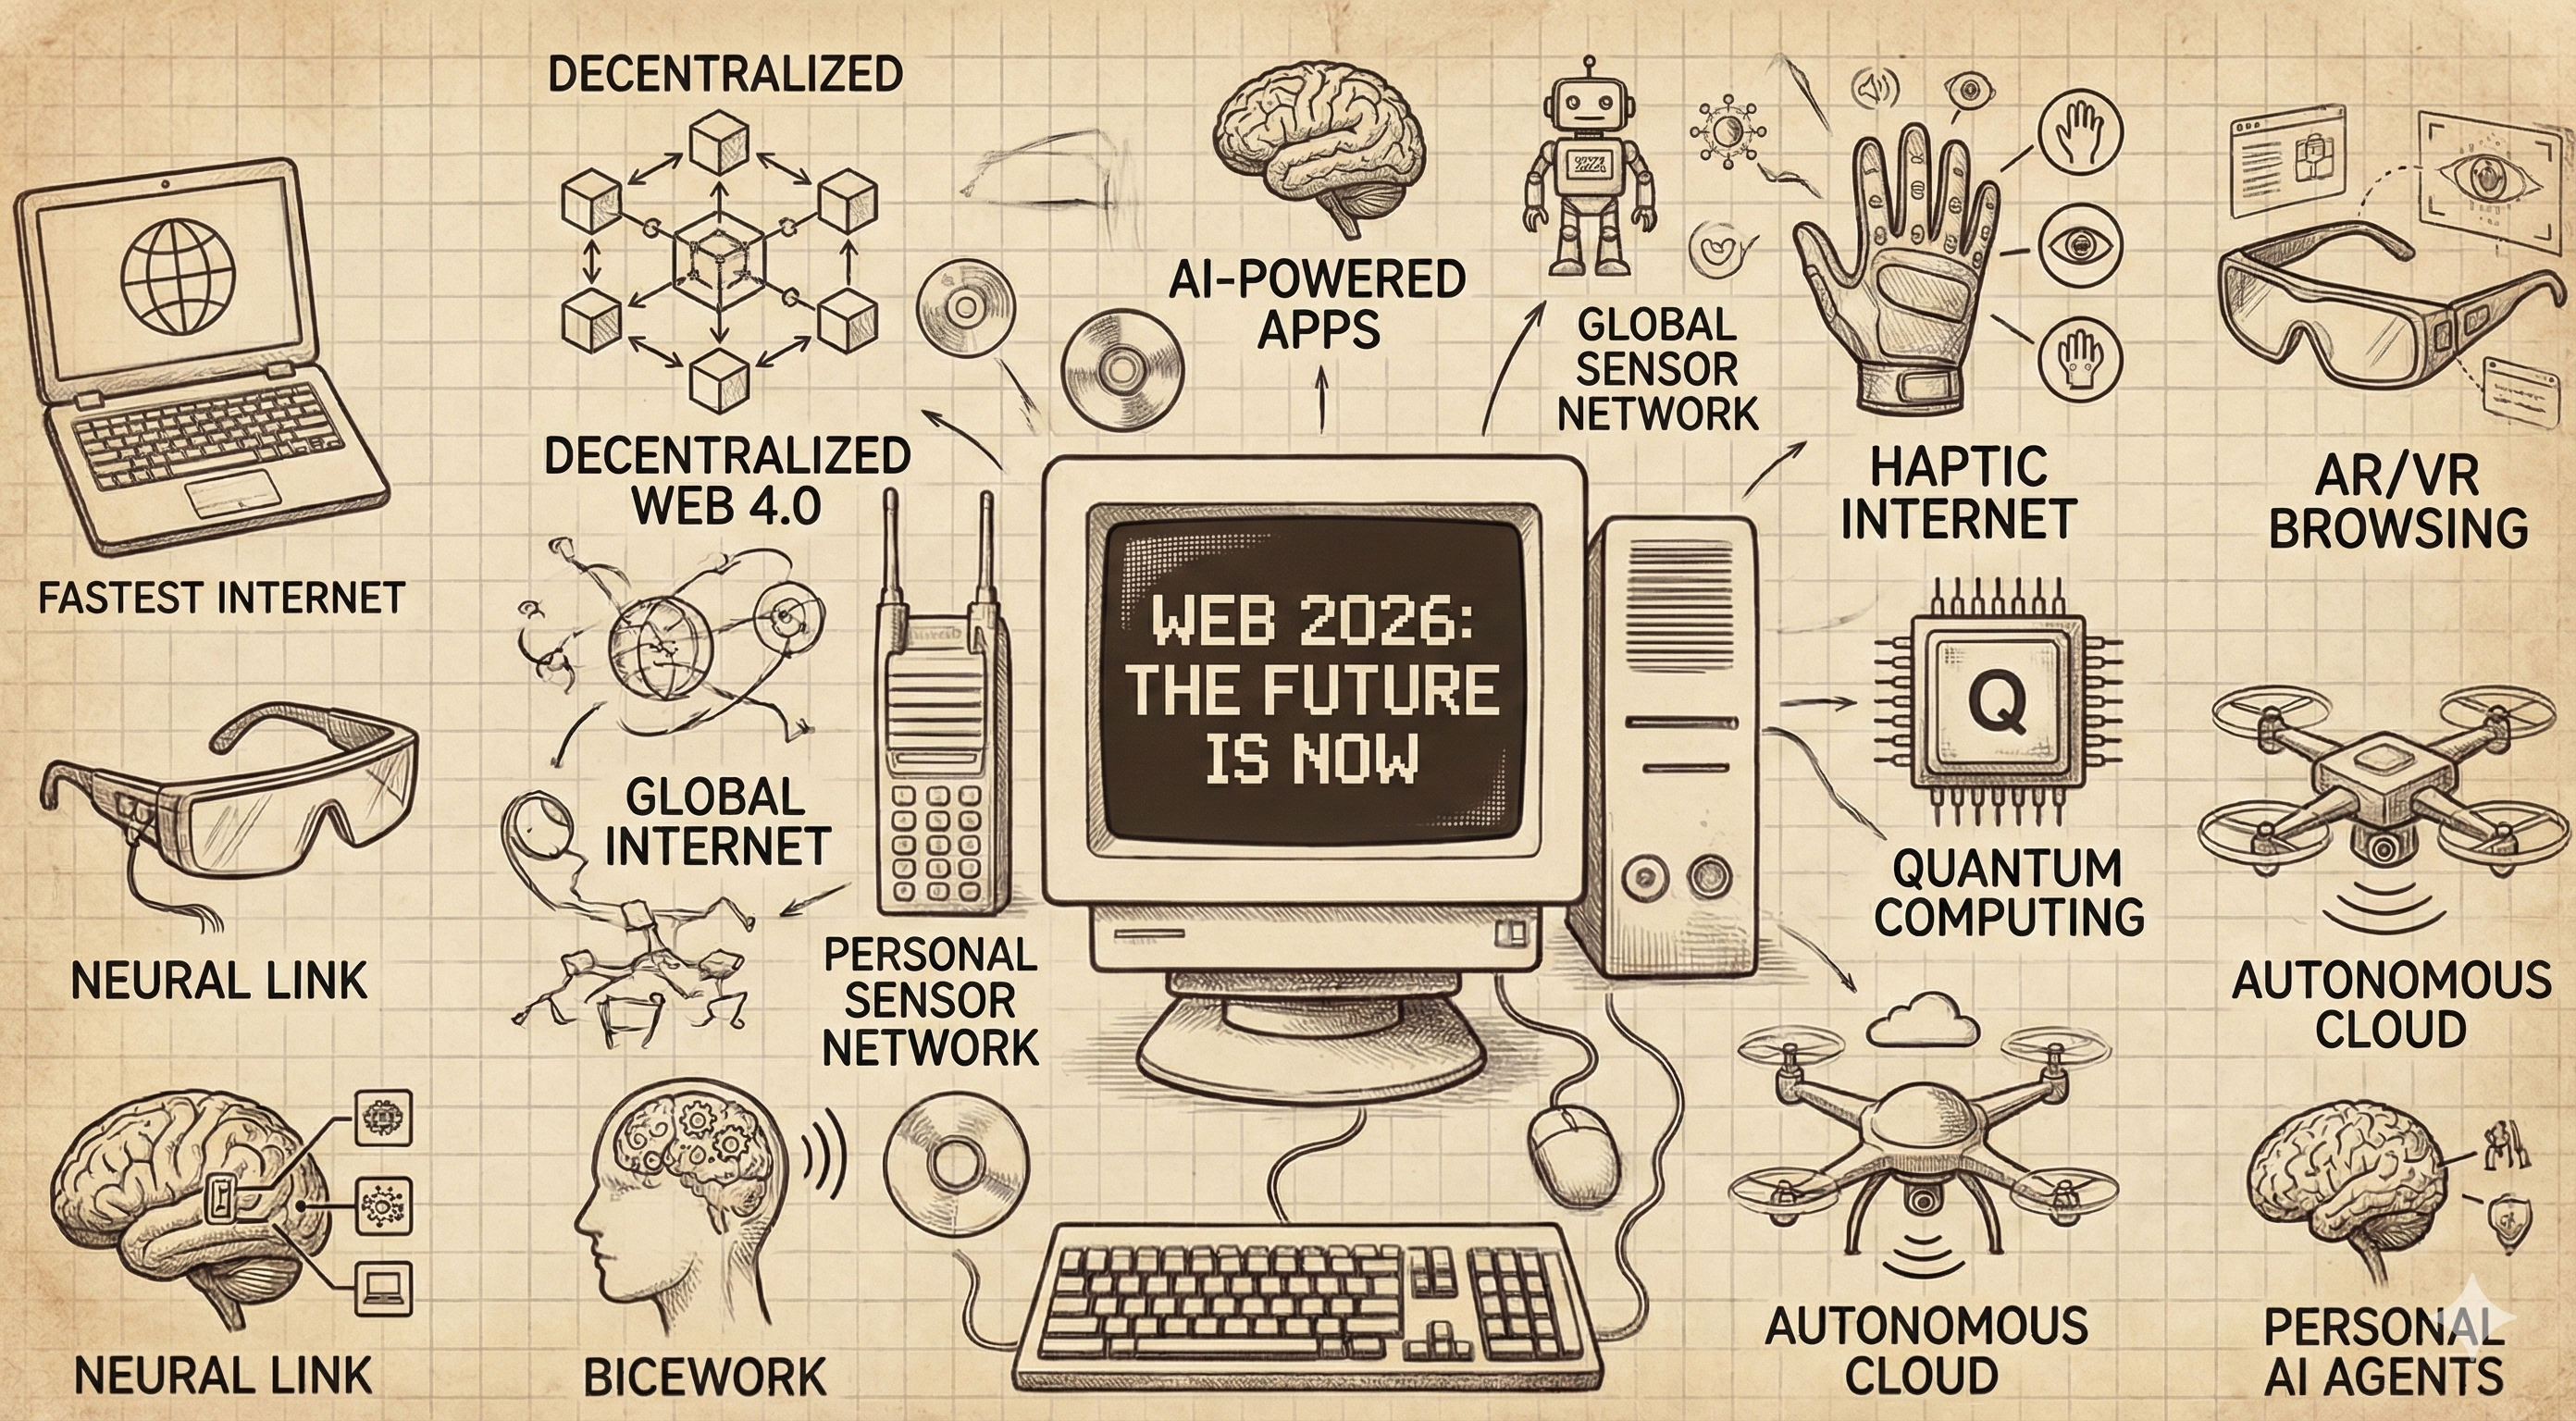
Web (2000) vs Web (2026); Generated by Nano Banana Pro
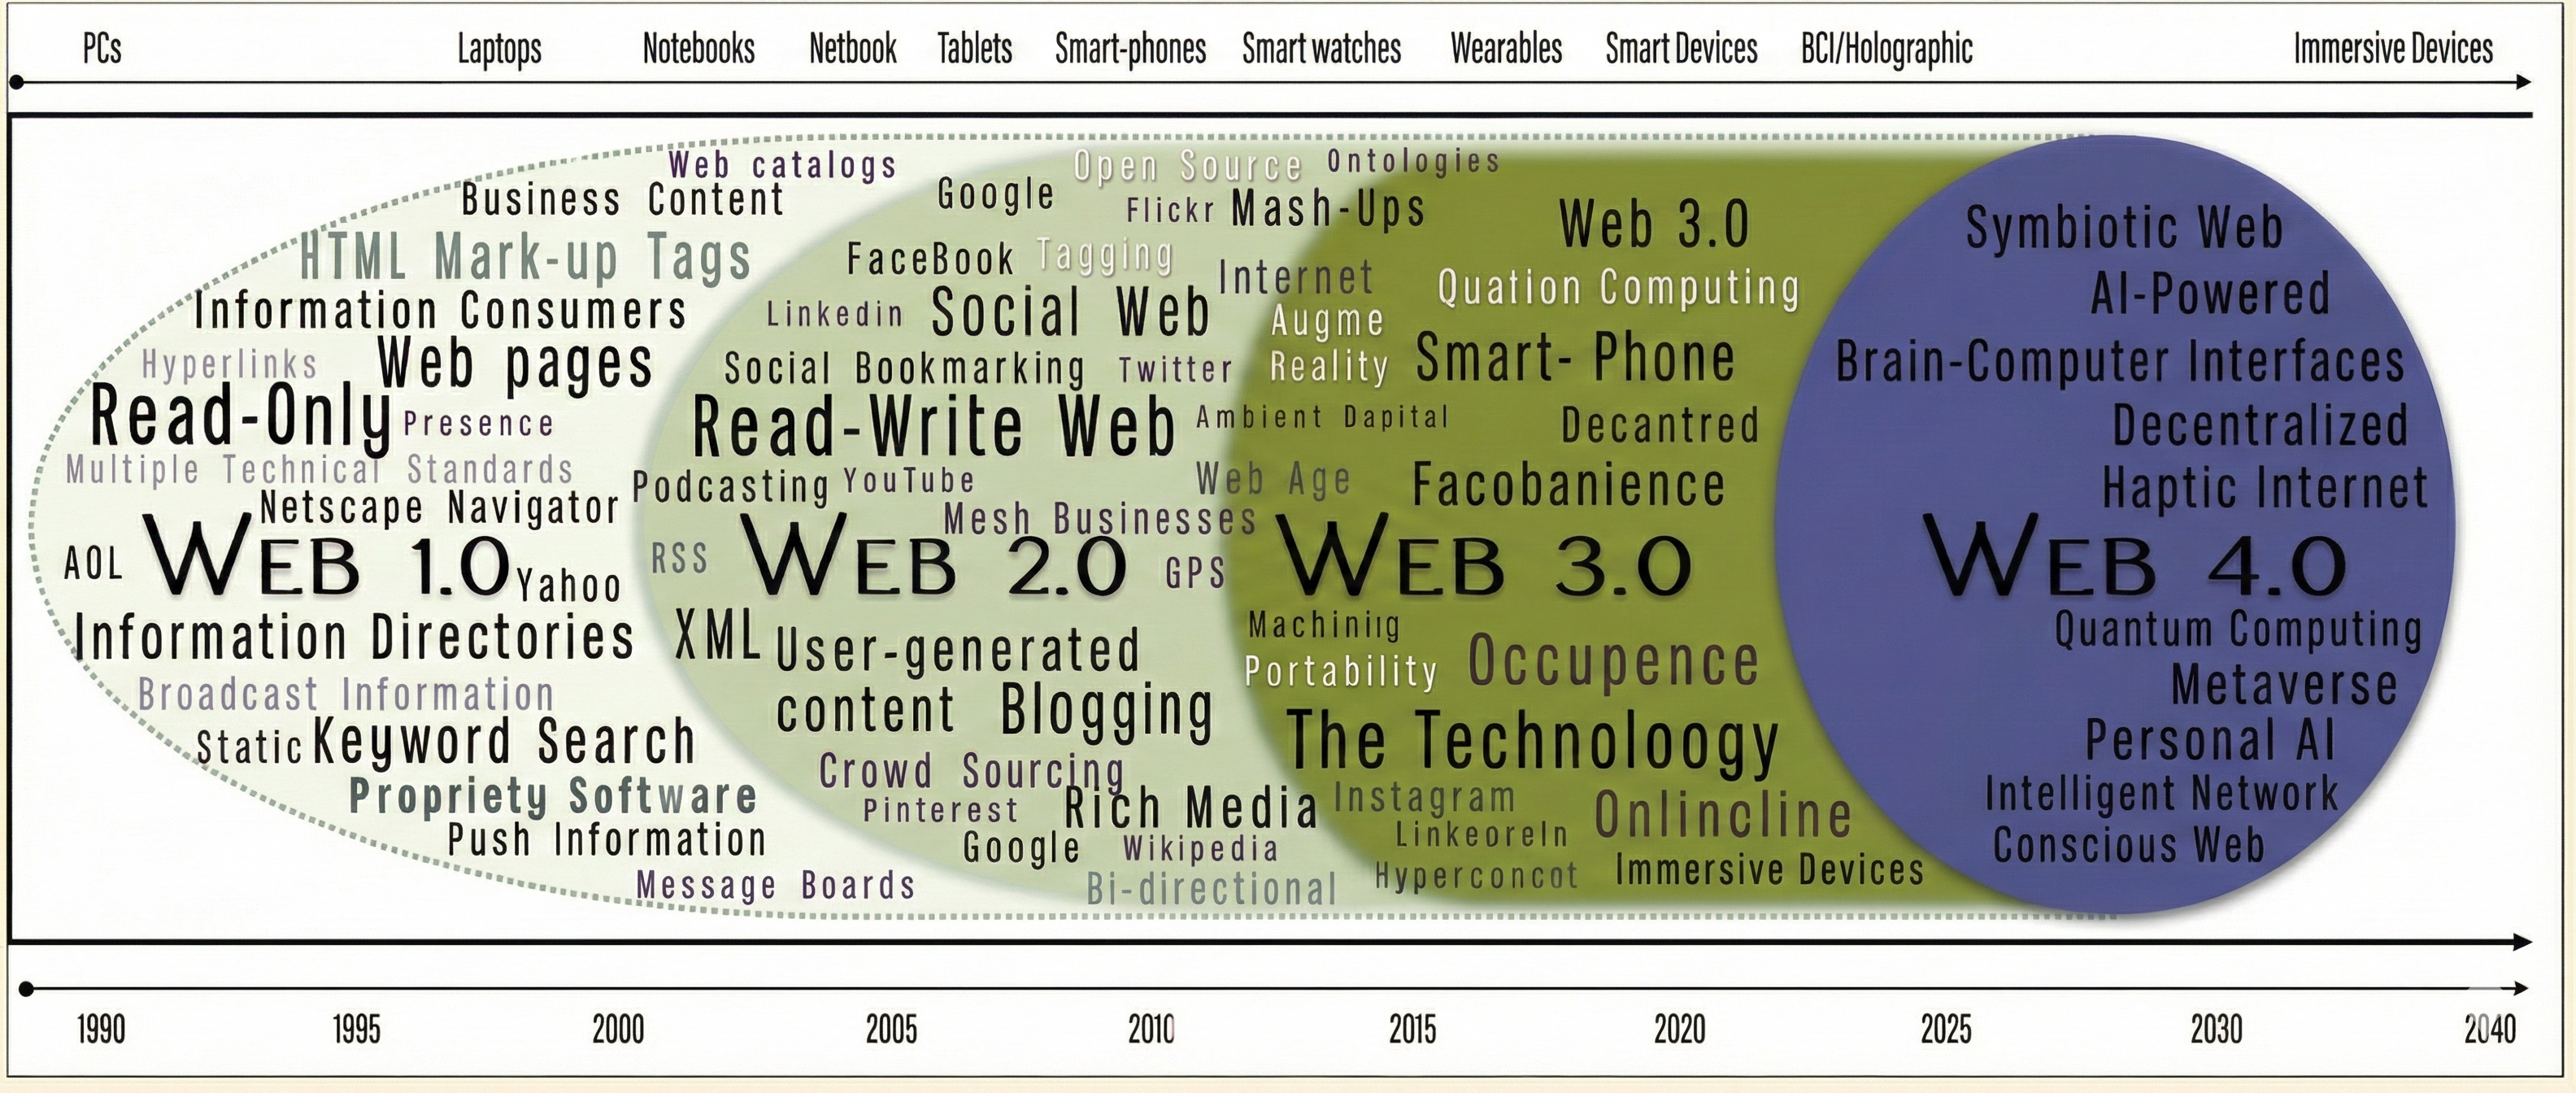
Web 1.0: The Static Web (1990s-2000s)
- Characteristics:
- Read-only, static HTML pages
- One-way communication (publisher → reader)
- Directory-based navigation
- Examples: Early Yahoo!, corporate brochure sites
- Analytics capability:
- Server log analysis only
- Basic hit counters
- Limited user insight

Web 2.0: The Social Web (2000s-2010s)
- Characteristics:
- User-generated content
- Social interaction and sharing
- Rich, dynamic interfaces
- Examples: Facebook, YouTube, Wikipedia, blogs
- Analytics capability:
- Behavioural tracking (clicks, time on page)
- Social metrics (shares, likes, comments)
- Conversion tracking

Web 3.0: The Semantic Web (2010s onwards)
- Characteristics:
- Decentralised architecture
- Machine-readable data
- AI and blockchain integration
- Examples: Cryptocurrencies, NFTs, DApps
- Analytics capability:
- Cross-platform tracking
- Predictive analytics with ML
- On-chain analytics

Web 4.0: The Intelligent Web (Emerging)
- Characteristics:
- AI-native interactions
- Immersive experiences (XR/VR/AR)
- Symbiotic human-machine collaboration
- Examples: Large Language Models, spatial computing
- Analytics implications:
- Conversational analytics
- Multi-modal tracking (voice, gesture, gaze)
- Real-time personalisation at scale

Evolution Summary

Key insight: Each web generation creates new data types and analytics opportunities.
Web Analytics Fundamentals
📊 Quick Poll
Wooclap Question
Go to wooclap.com and enter code: LJHCNE
What percentage of e-commerce website visitors do you think make a purchase?
A. 1-3%
B. 3-10%
C. 10-20%
D. 20-35%
🎯 Prediction Reveal #1
Answer: Typically 1-3% (average is about 2.5-3%)
This is why understanding user behaviour is so critical!
What is Web Analytics?
Definition
Web analytics is the collection, measurement, analysis, and reporting of website data to understand and optimise web usage.
- Descriptive: What happened? (page views, sessions, users)
- Diagnostic: Why did it happen? (funnel drop-offs, A/B testing)
- Predictive: What will happen? (churn prediction, lifetime value)
- Prescriptive: What should we do? (personalisation, recommendations)
ShopSocial Question: How can we use analytics to increase purchases and engagement?
Why Web Analytics Matters
Modern Web Analytics Tools
- Evolution of analytics platforms:
- Traditional: Google Analytics (Universal Analytics, sunset July 2023)
- Current: Google Analytics 4 (GA4), event-based, privacy-first (2020+)
- Privacy-focused alternatives:
- Matomo: Open-source, GDPR-compliant
- Plausible: Cookie-less, lightweight
- Fathom Analytics: Privacy-first
- Commercial: Mixpanel, Amplitude, Heap
The Shift to Privacy-First Analytics
- Regulatory pressure:
- GDPR (2018) and global privacy laws
- Third-party cookie deprecation (Chrome 2024-2025)
- User expectations:
- Growing privacy awareness
- Ad blockers now mainstream (40%+ of users)
- GA4 key changes:
- Event-based model (not session-based)
- Cross-platform tracking (web + app unified)
- Machine learning for predictive insights
- Privacy-preserving measurement
Analytics Across Web Eras
| Era | Focus | Data Sources | Key Challenges |
|---|---|---|---|
| Web 1.0 | Basic metrics (hits, visits) | Server logs | Limited interaction data |
| Web 2.0 | User engagement | Cookies, JS tags, social APIs | Data volume, privacy concerns |
| Web 3.0 | Cross-platform, decentralised | Blockchain, IoT, AI platforms | Complexity, integration |
| Web 4.0 | Intent and context | Multi-modal sensors, LLMs | Ethics, real-time processing |
ShopSocial operates in Web 2.0/3.0: We need to track user behaviour whilst respecting privacy.
Web Tracking Technologies
📊 Quick Poll: Tracking Awareness
Wooclap Question
Go to wooclap.com and enter code: LJHCNE
How many tracking cookies do you think are placed when you visit a typical news website?
A. 5-20 B. 20-50
C. 50-100
D. 100-200+
🎯 Prediction Reveal #2
Answer: Often 100-200+ cookies!
Let’s investigate this together…
How Are You Being Tracked?
Reflection
Think about the last time you browsed online. Did you notice ads related to your recent searches? Ever wonder how that happens?
Scenario
- You search for “running shoes” on Amazon. Later, you notice:
- Shoe ads on your Facebook feed
- Sports shops highlighted on Google Maps
- Running-related content in your Twitter/X feed
- How are these connected? What’s the common thread?
Tracking Method 1: Cookies
- Definition: Small text files stored on your device by websites
- Contents: Site preferences, login status, tracking identifiers
- Structure: Name, value, attributes (expiration, domain, secure flags)
How Cookies Work
- You visit a website
- The server sends a cookie to your browser
- Your browser stores the cookie locally
- On subsequent visits, the browser sends the cookie back
- The site recognises you and customises your experience
Types of Cookies
- Session cookies: Temporary; deleted when browser closes
- Persistent cookies: Stored for a set period (days to years)
- First-party cookies: Set by the website you’re visiting
- Third-party cookies: Set by other domains (advertisers, trackers)
- Supercookies: Set at top-level domains, harder to clear

ShopSocial needs: Session cookies (cart), persistent cookies (login), but should avoid unnecessary third-party tracking.
Cookie Purposes
- Session management: Unique session IDs for maintaining state (e.g., shopping cart)
- Personalisation: Remember user preferences (e.g., language, layout)
- Tracking: Monitor browsing behaviour across pages and sessions

Tracking Method 2: Web Server Logs
- Files automatically created by web servers
- Record every request made to the server
- Data captured:
- IP address and timestamp
- Requested URL and HTTP method
- Referrer (where user came from)
- User agent (browser/device info)
- Response status code

Example: Server Log Entry
Log types:
- Access logs: All requests to the server
- Error logs: Server issues and errors
- Event logs: Specific user actions (logins, transactions)
Tracking Method 3: Web Beacons
- Also known as tracking pixels, pixel tags, or clear GIFs
- Tiny, transparent images (typically 1x1 pixel)
- Embedded in emails and web pages
- How they work:
- When content loads, the beacon loads too
- Sends a signal back to the server
- Records that content was viewed
- Common uses:
- Email open tracking
- Page view confirmation
- Ad impression counting
- Cross-site tracking
Web Beacons Explained
Beacons in Practice
- Marketing usage:
- Track email campaign effectiveness
- Measure ad viewability
- Attribution modelling
- Privacy concerns:
- Often invisible to users
- Can track without explicit consent
- Combine data across multiple sites

Tracking Method 4: JavaScript

JavaScript Tags
JavaScript enables rich, client-side tracking of user interactions:
- A powerful programming language used in web development.
- Enables dynamic content and interactivity on web pages.
- Runs on the user’s browser, allowing real-time page updates without reloading.
JavaScript Capabilities & Limitations
- Event tracking:
- Button clicks, form submissions
- Video plays, file downloads
- Scroll depth, time on page
- User journey:
- Page navigation sequences
- Session duration and engagement
- Cross-page behaviour
- Best Practices
- functionality vs performance
- compatibility & accessibility across different browsers and devices.
- privacy standards and user consent, especially in tracking.
- Limitations
- Not all visitors have JavaScript enabled.
- Tags need to be carefully made.
- Data collected browser-side, not server-side.
🔍 Hands-On Activity: How Unique Are You?
Activity (3 minutes)
Even without cookies, websites can identify you through “browser fingerprinting”.
Try it yourself:
- Go to: coveryourtracks.eff.org
- Click “Test Your Browser”
- Check your results:
- Is your browser blocking tracking ads?
- Is your browser blocking invisible trackers?
- How unique is your fingerprint?
Discussion
If your fingerprint is unique among millions, does blocking cookies even matter?
📊 Quick Poll: Ad Blockers
Wooclap Question
Go to wooclap.com and enter code: LJHCNE
Do you use an ad blocker?
A. Yes, always
B. Yes, but I whitelist some sites
C. No
D. What’s an ad blocker?
🎯 Prediction Reveal #3
Current ad blocker usage: ~40% of internet users globally
This is why privacy-first analytics matters for businesses!
Advanced: Packet Sniffing
- Definition: Capture/analyse data packets transmitted across a network
- Legitimate uses:
- Network troubleshooting and optimisation
- Security monitoring and intrusion detection
- Quality of service analysis
- Privacy concerns:
- Can intercept unencrypted data
- ISP-level tracking possible
- Requires strong ethical guidelines
Web Basics
🤔 Why Do We Need to Understand Web Structure?
The Big Picture
To analyse the web, we need to understand how web pages are built.
Later in this course, you’ll learn to:
- Scrape data from websites automatically
- Extract product prices, reviews, and social data
- Build your own analytics dashboards
Think of it this way:
- A chef needs to understand ingredients before cooking
- A data analyst needs to understand web structure before scraping
What Makes a Web Page?
| Technology | Role | Analogy |
|---|---|---|
| HTML | Structure & Content | The skeleton and organs |
| CSS | Styling & Layout | The skin and clothes |
| JavaScript | Interactivity | The muscles and brain |
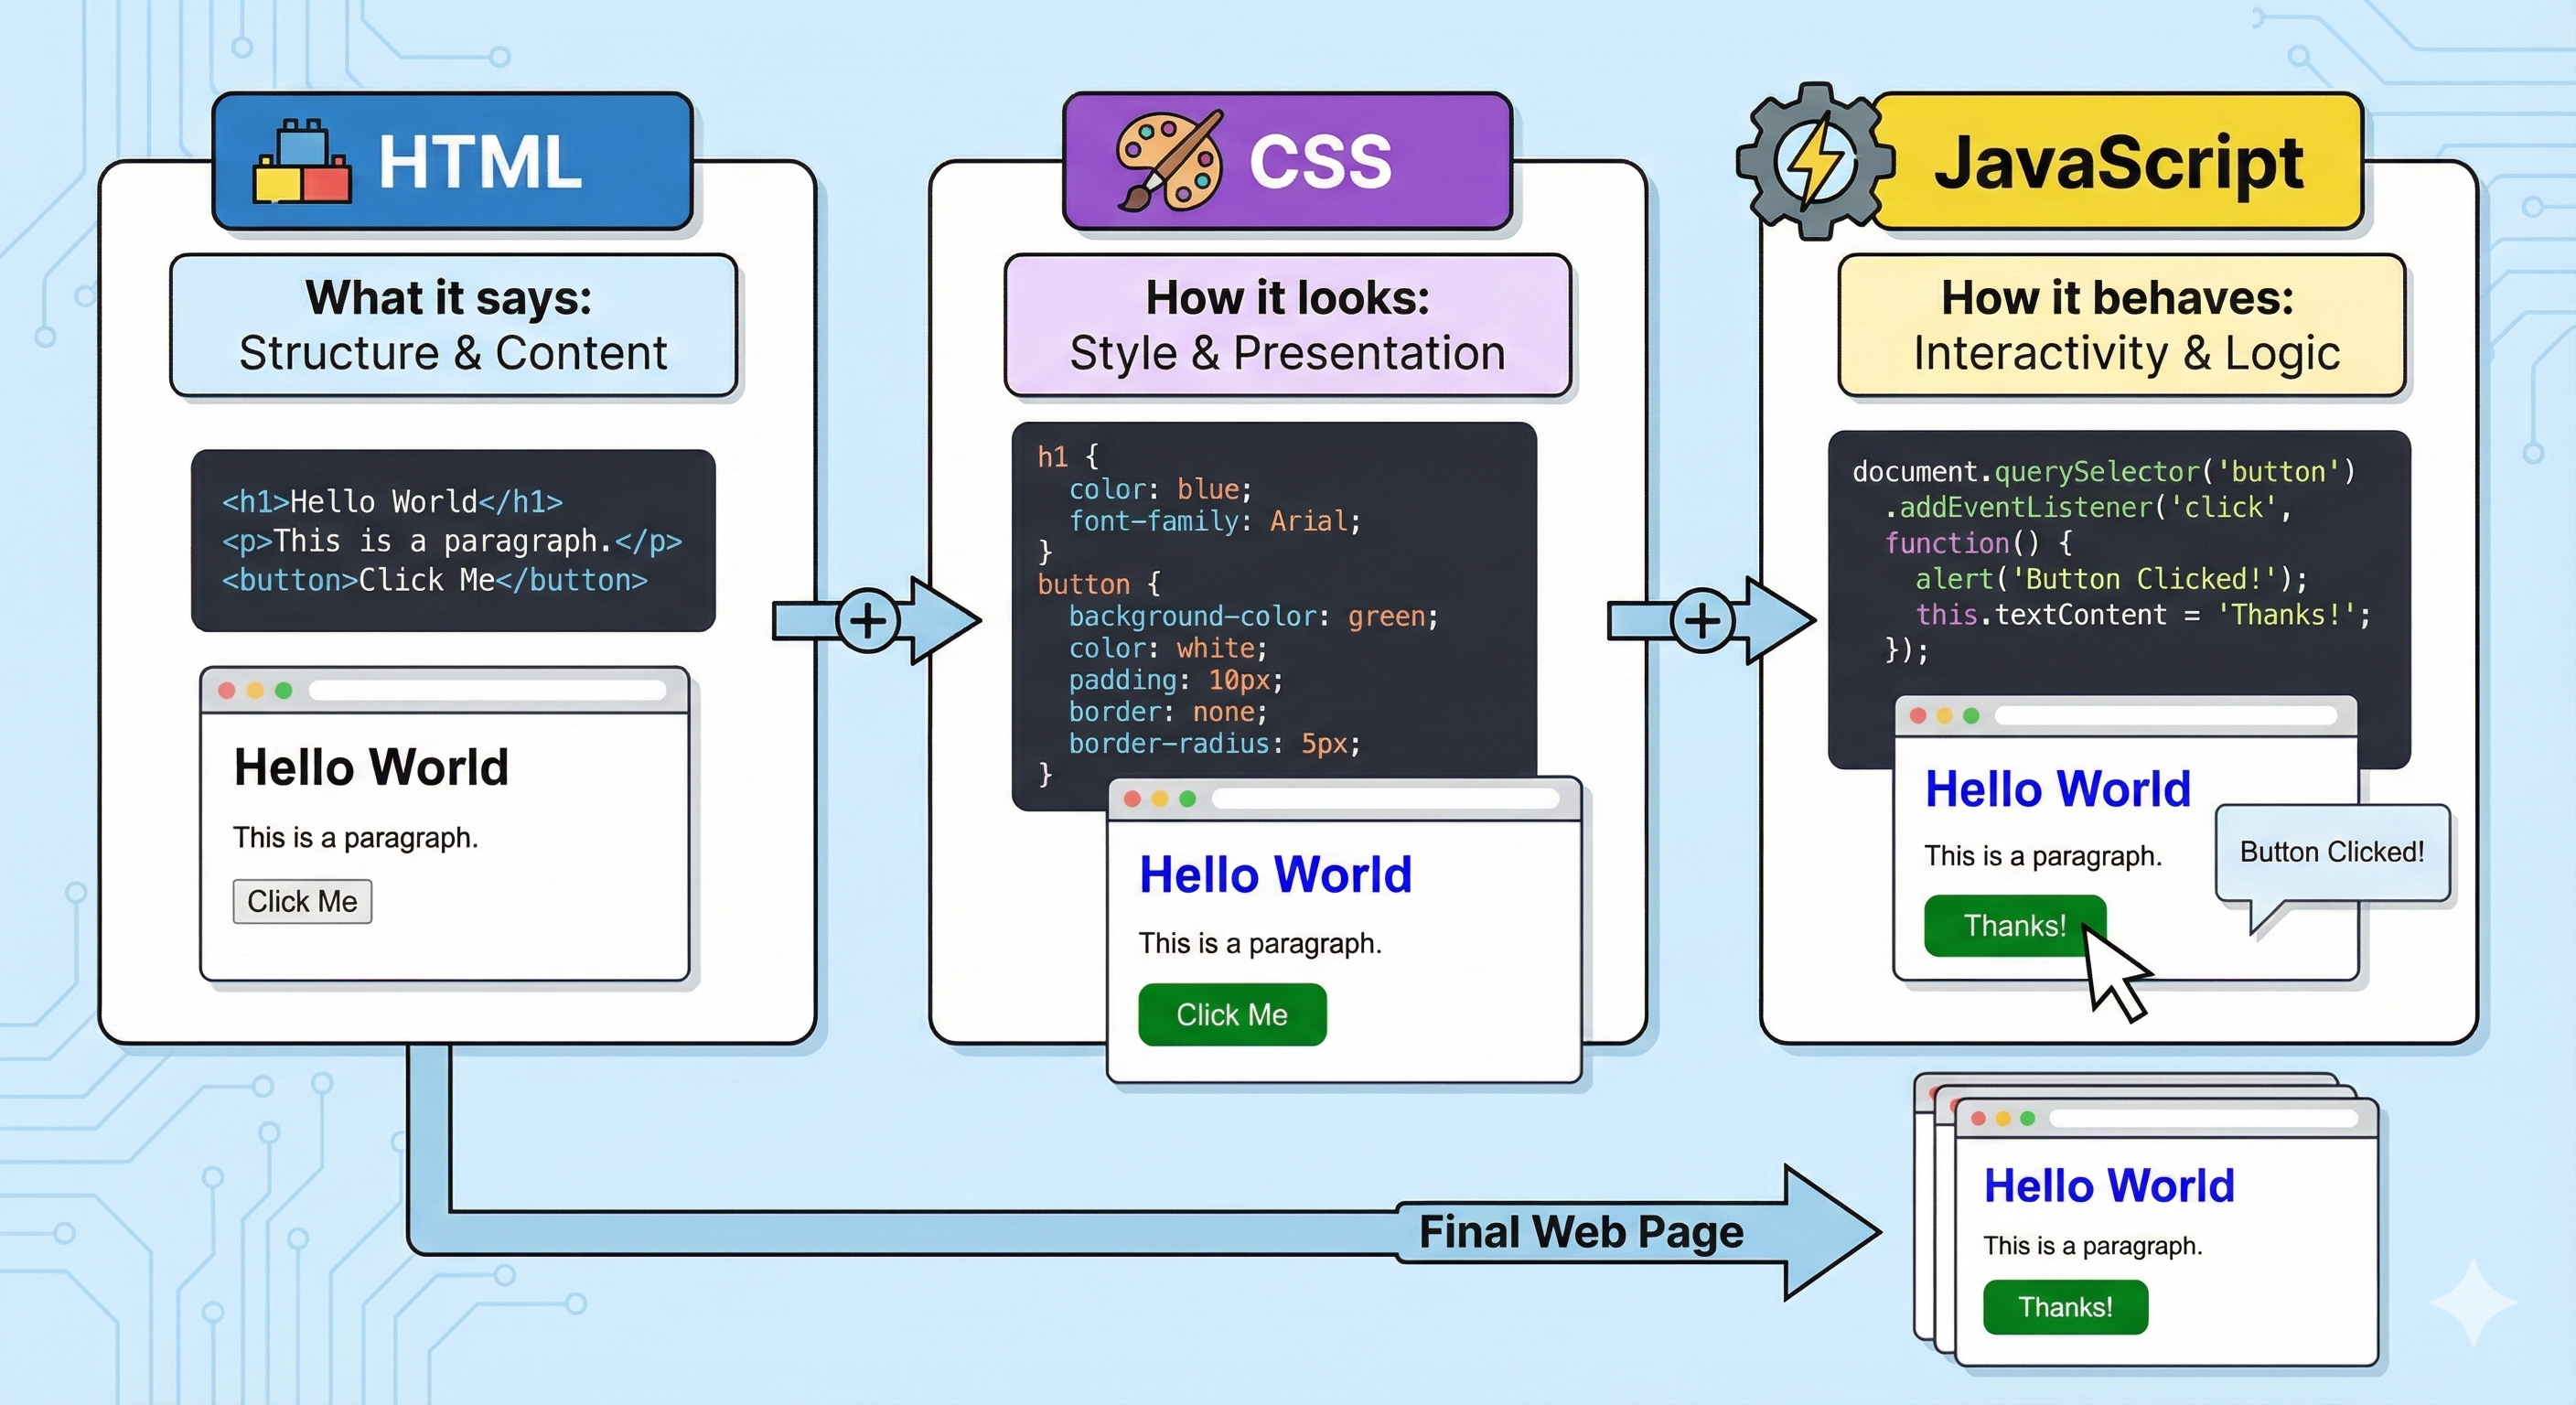
HTML: The Language of Web Content
HTML = HyperText Markup Language
- Uses tags to mark up content
- Tags come in pairs: opening
<tag>and closing</tag> - Tags can be nested inside each other
Reading this: “This is an HTML document with a title ‘ShopSocial - Best Deals’, a main heading, and a paragraph.”
HTML Tags You’ll Use for Scraping
| Tag | Purpose | Example | What You Might Extract |
|---|---|---|---|
<h1> to <h6> |
Headings | <h1>Product Name</h1> |
Product titles |
<p> |
Paragraph | <p>Great quality!</p> |
Descriptions, reviews |
<a> |
Link | <a href="url">Click</a> |
URLs, link text |
<img> |
Image | <img src="photo.jpg"> |
Image URLs |
<div> |
Container | <div class="price">£99</div> |
Grouped content |
<span> |
Inline container | <span>4.5 stars</span> |
Small pieces of text |
<table> |
Table | <table>...</table> |
Structured data |
<ul>, <li> |
Lists | <ul><li>Item 1</li></ul> |
List items |
Key insight: Most data you want to scrape is wrapped in these tags!
Attributes: Extra Information on Tags
Tags can have attributes that provide additional information:
| Attribute | Purpose | Why It Matters for Scraping |
|---|---|---|
href |
Link destination | Extract URLs to follow |
src |
Image/script source | Get image URLs |
class |
CSS styling group | Find elements by class name |
id |
Unique identifier | Find specific elements |
alt |
Image description | Extract image descriptions |
class and id are crucial for web scraping! They help us locate specific data.
🔍 Hands-On: Inspect a Real Web Page
Activity (5 minutes)
Let’s explore how a real website is structured!
Instructions:
- Open amazon.co.uk (or any product page)
- Right-click on a product title → Inspect
- Look at the HTML panel that opens
- Find:
- What tag is the product title in? (
<h1>,<span>,<div>?) - Does it have a
classoridattribute? - Can you find the price? What tag is it in?
- What tag is the product title in? (
Share: What patterns do you notice? Are similar items in similar tags?
Real Example: ShopSocial Product Page
Imagine this is the HTML for a ShopSocial product:
<div class="product-card" id="product-12345">
  <h2 class="product-title">Wireless Headphones</h2>
  <img src="images/headphones.jpg" alt="Black wireless headphones">
  <p class="product-description">Premium sound quality with 20hr battery</p>
  <div class="price-container">
    <span class="original-price">£79.99</span>
    <span class="sale-price">£49.99</span>
  </div>
  <div class="rating">
    <span class="stars">★★★★☆</span>
    <span class="review-count">(127 reviews)</span>
  </div>
  <a href="/product/12345" class="buy-button">Add to Cart</a>
</div>
Question: If you wanted to scrape all sale prices, what would you look for?
Answer: Elements with class="sale-price"
📝 Quick Quiz: Find the Data
Using the ShopSocial HTML from the previous slide, how would you find:
| Data Needed | Tag to Look For | Class/ID to Use |
|---|---|---|
| Product name | ||
| Sale price | ||
| Number of reviews | ||
| Product image URL | ||
| Link to product page |
Answers:
| Data Needed | Tag to Look For | Class/ID to Use |
|---|---|---|
| Product name | <h2> |
class="product-title" |
| Sale price | <span> |
class="sale-price" |
| Number of reviews | <span> |
class="review-count" |
| Product image URL | <img> (src attribute) |
Inside class="product-card" |
| Link to product page | <a> (href attribute) |
class="buy-button" |
URLs: Web Addresses Explained
URL = Uniform Resource Locator (the address of a web page)
https://www.shopsocial.com/products/headphones?sort=price&page=2
└─┬──┘ └───────┬────────┘└─────────┬─────────┘└────────┬────────┘
protocol domain path parameters| Component | Example | Purpose |
|---|---|---|
| Protocol | https:// |
How to connect (secure) |
| Domain | www.shopsocial.com |
Which server |
| Path | /products/headphones |
Which page |
| Parameters | ?sort=price&page=2 |
Extra options (filtering, pagination) |
For scraping: Understanding URL parameters helps you navigate pagination and filters automatically!
How Analytics Code Fits In
Remember web beacons and JavaScript tracking?
<!DOCTYPE html>
<html>
<head>
  <title>ShopSocial</title>
  <!-- Analytics JavaScript goes in the head -->
  <script async src="https://www.googletagmanager.com/gtag/js?id=G-XXXXX"></script>
  <script>
    window.dataLayer = window.dataLayer || [];
    function gtag(){dataLayer.push(arguments);}
    gtag('js', new Date());
    gtag('config', 'G-XXXXX');
  </script>
</head>
<body>
  <h1>Welcome to ShopSocial</h1>

  <!-- Tracking pixel (beacon) often at the bottom -->
  <img src="https://tracking.com/pixel.gif?page=home" width="1" height="1">
</body>
</html>
🔍 Hands-On: View Page Source
Activity (3 minutes)
Let’s look at the complete HTML of a real page!
Instructions:
- Go to any website (e.g., bbc.co.uk)
- Right-click anywhere → View Page Source (not Inspect)
- You’ll see the raw HTML
- Use Ctrl+F to search for:
<script(How many JavaScript files?)pixelorbeacon(Any tracking pixels?)google(Any Google services?)
Note: Real websites have hundreds of lines of HTML - don’t be overwhelmed!
Web Scraping Preview
In this week’s lab session, you’ll learn to write Python code like this:
from bs4 import BeautifulSoup
import requests

# Get the webpage
page = requests.get('https://shopsocial.com/products')
soup = BeautifulSoup(page.content, 'html.parser')

# Find all product titles (using what we learned today!)
titles = soup.find_all('h2', class='product-title')

# Find all sale prices
prices = soup.find_all('span', class='sale-price')

# Extract the text
for title, price in zip(titles, prices):
    print(f"{title.text}: {price.text}")
See the connection? The class='product-title' directly uses what we learned about HTML classes!
Web Basics: Key Takeaways
HTML Structure:
- Web pages are built with HTML tags
- Tags have opening
<tag>and closing</tag> - Content is nested in a tree structure
classandidattributes help identify elements
Important Tags for Scraping:
<h1>-<h6>: Headings<p>: Paragraphs<a>: Links (checkhref)<img>: Images (checksrc)<div>,<span>: Containers
URLs:
- Protocol + Domain + Path + Parameters
- Parameters control filtering and pagination
Developer Tools:
- Right-click → Inspect: See element HTML
- Right-click → View Source: See full page HTML
- Network tab: See all requests
Coming up: You’ll use this knowledge to build web scrapers in Python!
Web Measurement and Metrics
Clickstream Analysis
Definition
Clickstream data tracks the sequence of clicks (page views) a user makes whilst navigating through a website.
| Term | Definition |
|---|---|
| Hit | Any request for a file from the web server |
| Page view | A request to load a single page |
| Session | A group of user interactions within a time frame (typically 30 mins) |
| Unique visitor | A distinct individual visiting the site (identified by cookie/IP) |
| Bounce | A session with only a single page view |
| Conversion | Completion of a desired action (purchase, sign-up) |
Core Web Metrics
Important
Bounce Rate (for a page): \[ \text{Bounce Rate} = \frac{\text{Single-page sessions starting on this page}}{\text{Total sessions starting on this page}} \]
Exit Rate (for a page): \[ \text{Exit Rate} = \frac{\text{Sessions ending on this page}}{\text{Total sessions that included this page}} \]
Conversion Rate: \[ \text{Conversion Rate} = \frac{\text{Number of conversions}}{\text{Total sessions (or visitors)}} \]
Average Page Depth: \[ \text{Average Page Depth} = \frac{\text{Total page views}}{\text{Total sessions}} \]
Understanding Bounce vs Exit Rate
Bounce Rate:
- Measures single-page sessions
- High bounce = users leave immediately
- Good for: Landing pages, blog posts
- Problematic for: Product pages, homepages
When high bounce is acceptable:
- Contact page (found the info)
- Blog article (read and left)
- Single-page applications
Exit Rate:
- Measures where users end their journey
- Every session has an exit somewhere
- Expected high: Thank you pages, confirmation pages
- Problematic high: Checkout pages, product pages
Key difference:
- Bounce = entered & left on same page
- Exit = left from this page (may have visited others first)
Worked Example: Calculate the Metrics
- Given these five visitor journeys, calculate the metrics below:
- The exit rate of the home page.
- The bounce rate of the home page.
- The conversion rate (purchase confirmed).
- The average page depth.
| Visitor 1 | Visitor 2 | Visitor 3 | Visitor 4 | Visitor 5 |
|---|---|---|---|---|
| Home | Home | Home | Home | Products |
| Products | About | Products | ||
| Product 1 | Products | Basket | ||
| Basket | Home | Checkout | ||
| Checkout | ||||
| Purchase confirmed |
Solution
| Visitor 1 | Visitor 2 | Visitor 3 | Visitor 4 | Visitor 5 |
|---|---|---|---|---|
| Home | Home | Home | Home | Products |
| Products | About | Products | ||
| Product 1 | Products | Basket | ||
| Basket | Home | Checkout | ||
| Checkout | ||||
| Purchase confirmed |
Answers:
- Exit rate of Home page: 2/4 = 50% (V1 and V3 exited on Home; V1-V4 visited Home)
- Bounce rate of Home page: 1/4 = 25% (only V1 bounced; 4 sessions started on Home)
- Conversion rate: 1/5 = 20% (1 purchase from 5 visitors)
- Average page depth: 16/5 = 3.2 pages (1+6+4+4+1 = 16 total page views)
Funnel Analysis
Definition: Tracking and analysing the steps users take towards a specific goal or conversion.
| Component | Description |
|---|---|
| Entry point | Where users begin (e.g., landing page, homepage) |
| Intermediate steps | Key actions towards the goal (e.g., view product, add to cart) |
| Conversion | The final goal (e.g., purchase, sign-up) |
| Drop-off points | Stages where users exit without converting |
ShopSocial Funnel Example
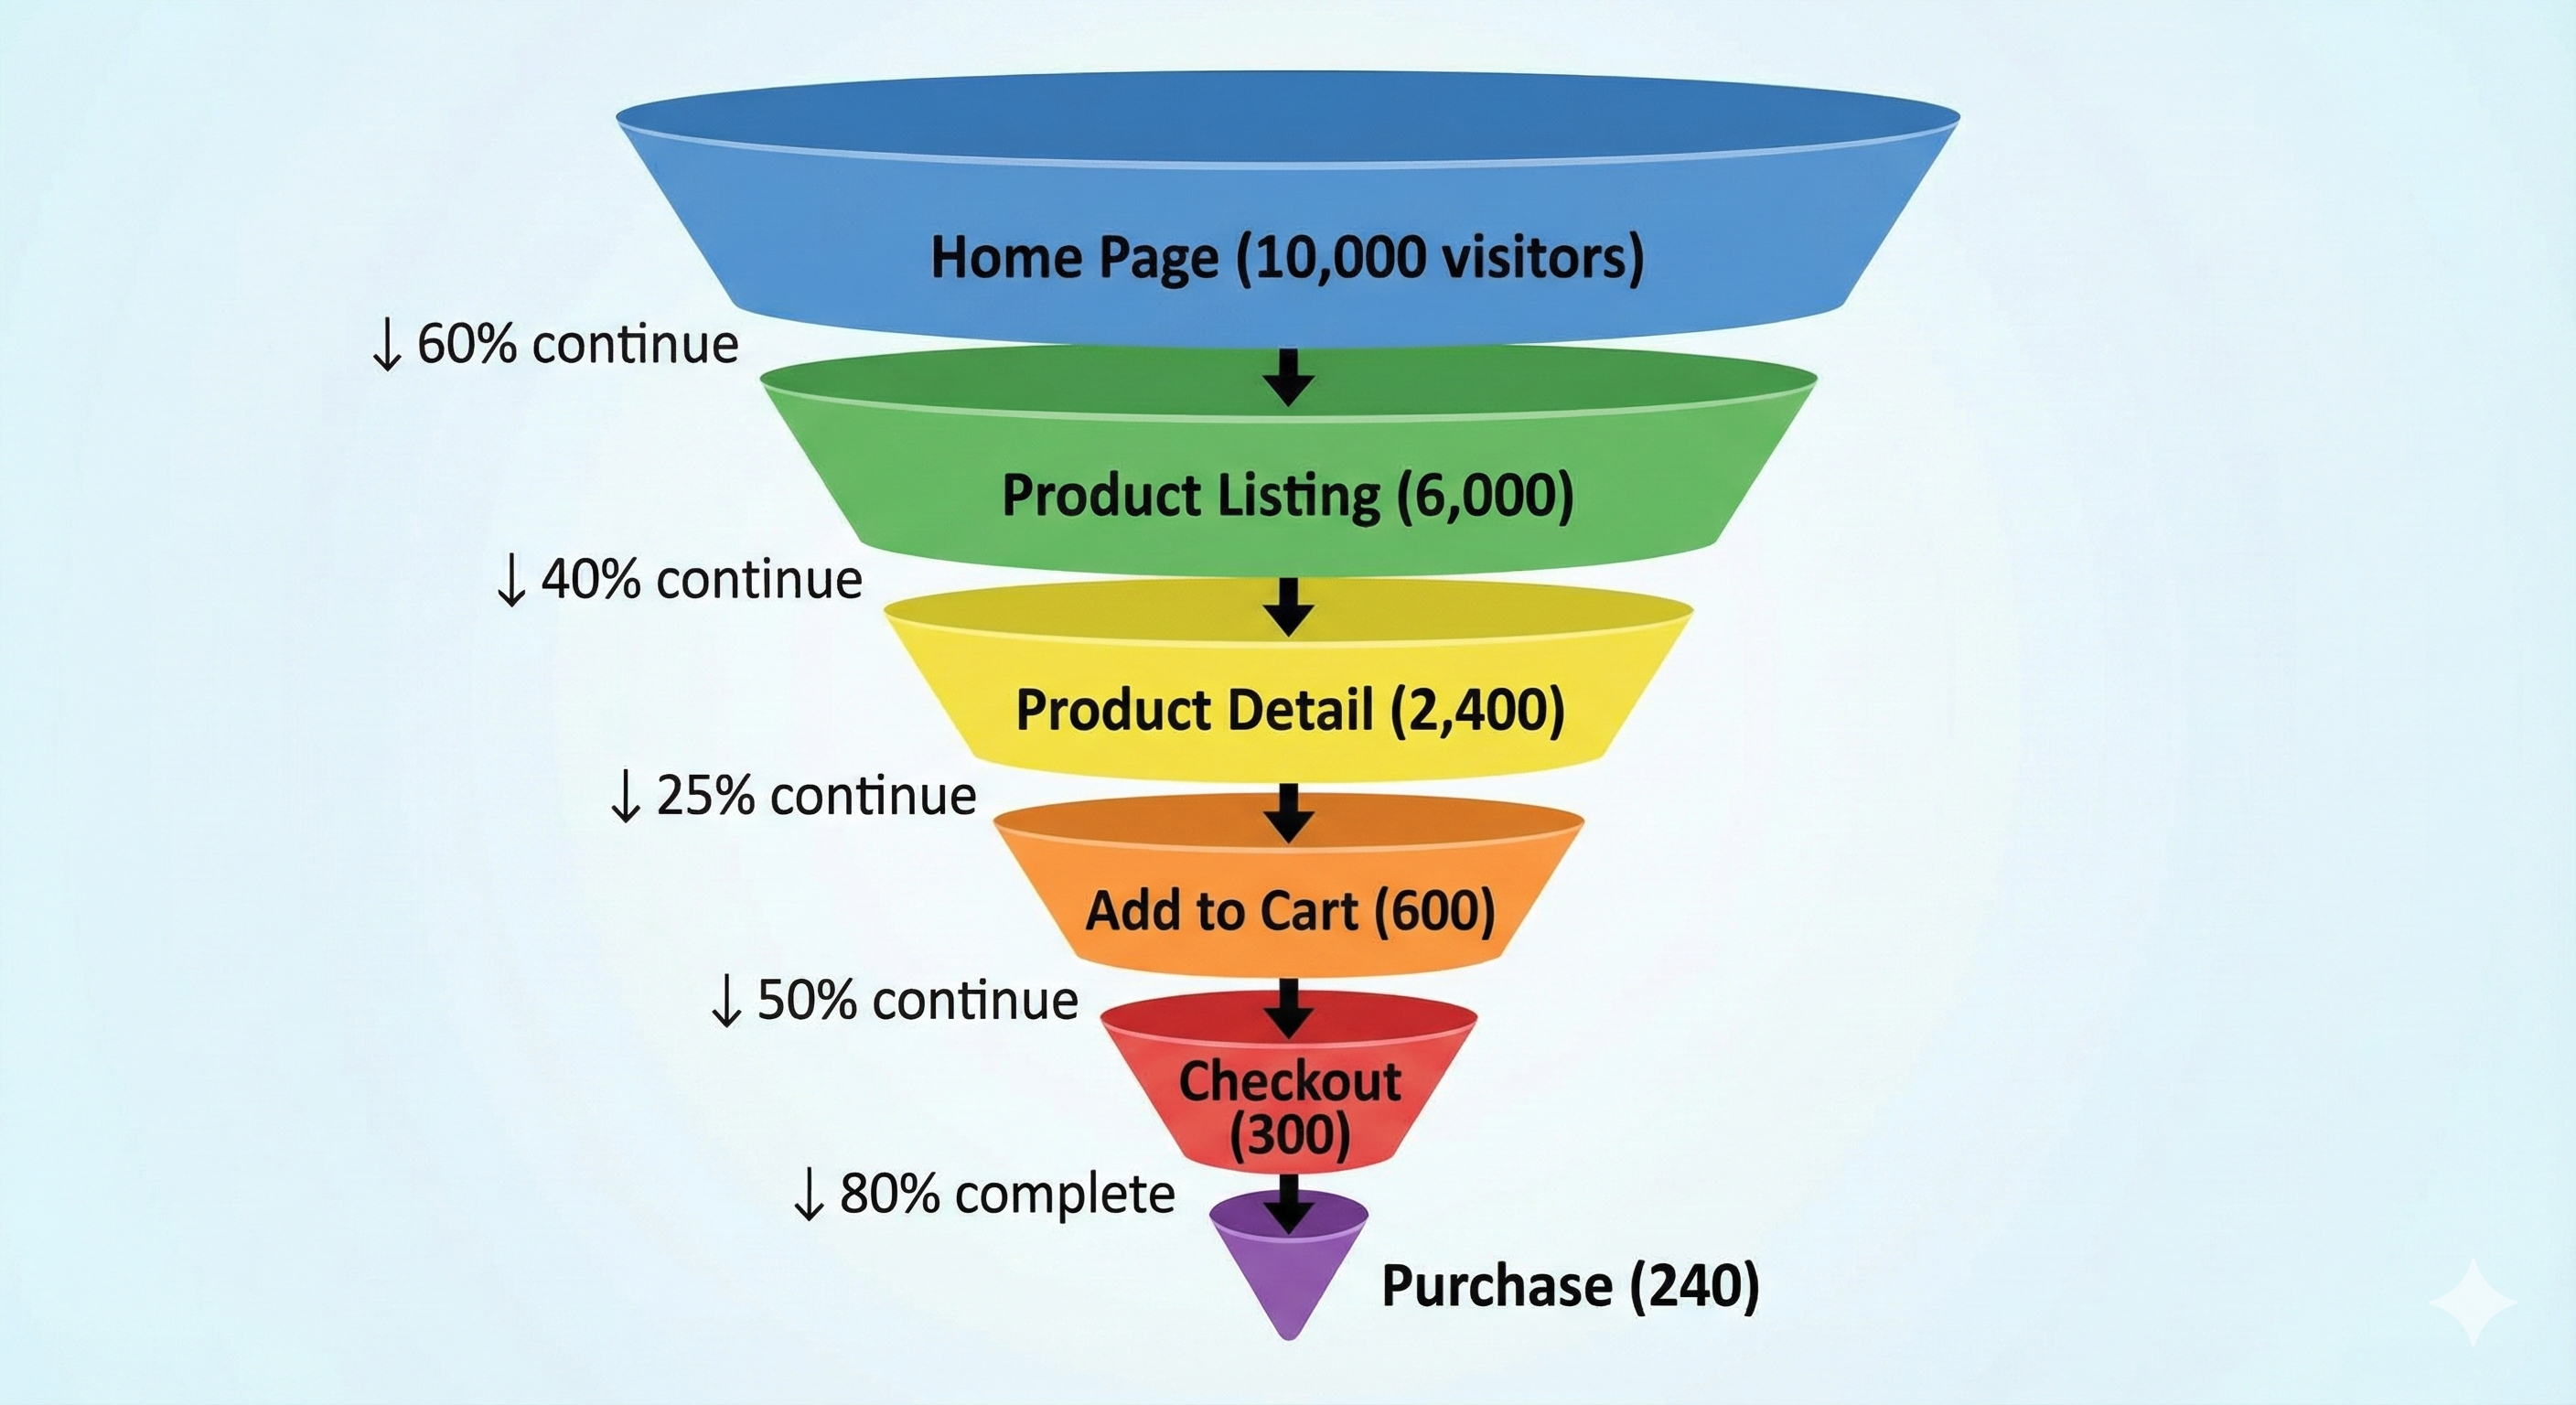
Key insights:
- Overall conversion rate: 240/10,000 = 2.4%
- Biggest drop-off: Product Detail → Add to Cart (75% leave)
- Action: Investigate product pages. Pricing? Images? Reviews? Trust signals?
Customer Journey Mapping
The customer journey extends beyond a single session, encompassing all touchpoints with your brand:
| Stage | Description | ShopSocial Example |
|---|---|---|
| Awareness | Customer discovers your brand | Social media ad, Google search |
| Consideration | Researches and compares options | Browse products, read reviews |
| Decision | Makes a purchase | Checkout and payment |
| Retention | Post-purchase engagement | Order tracking, support |
| Advocacy | Recommends to others | Reviews, social shares, referrals |
Heatmaps: Visualising User Behaviour
What heatmaps show:
- Where users click (click maps)
- How far users scroll (scroll maps)
- Where users move their cursor (move maps)
- Areas of attention and engagement
Insights from heatmaps:
- Are users clicking on non-clickable elements?
- Is important content below the fold?
- Do users find navigation intuitive?

Eye Tracking: Advanced Attention Analysis
How it works:
- Specialised hardware tracks eye movements
- Records gaze duration, sequence, and intensity
- Creates precise attention maps
Provides data on:
- What users actually look at (vs cursor position)
- Reading patterns (F-pattern, Z-pattern)
- Ad blindness and banner blindness
- Optimal placement for key content
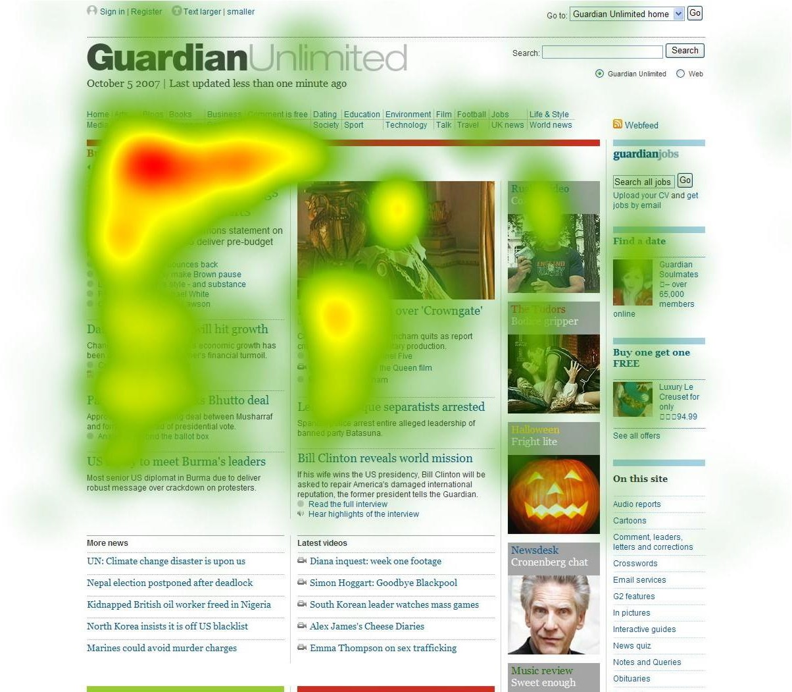
Eye Tracking in Practice
Google Analytics 4: Quick Tour

Implementing GA4

Summary and Next Steps
Key Takeaways
Web Evolution:
- Web 1.0 → 2.0 → 3.0 → 4.0
- Each era brings new data types and analytics capabilities
Tracking Technologies:
- Cookies (first-party essential, third-party declining)
- Server logs, web beacons, JavaScript tags
Web Basics:
- HTML provides structure (tags, attributes)
classandidattributes help locate data- URLs: protocol + domain + path + parameters
Core Metrics:
- Bounce rate vs exit rate
- Conversion rate
- Average page depth
- Funnel analysis
Measurement Tools:
- Clickstream analysis
- Funnel visualisation
- Heatmaps and eye tracking
- GA4 and alternatives
Looking Ahead
Next week: Search Engines and Web Graph
- How search engines crawl and index the web
- PageRank algorithm and link analysis
- Web graph structure and analysis
Course assessment reminder:
- Lab exercises contribute to your practical skills
- Apply concepts from lectures to ShopSocial scenarios
References
Questions?
Thank you!
Dr. Zexun Chen
📧 Zexun.Chen@ed.ac.uk
